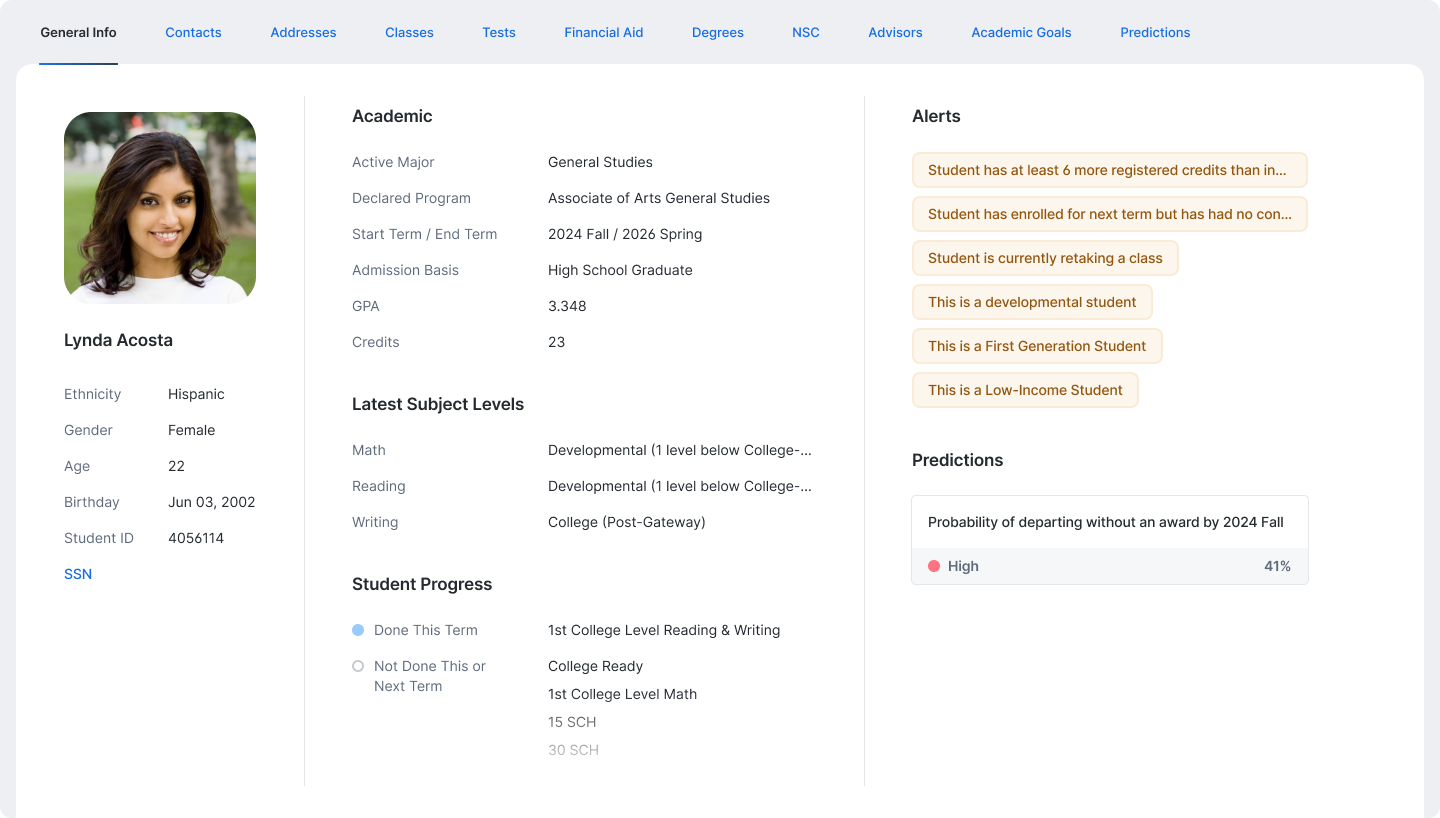
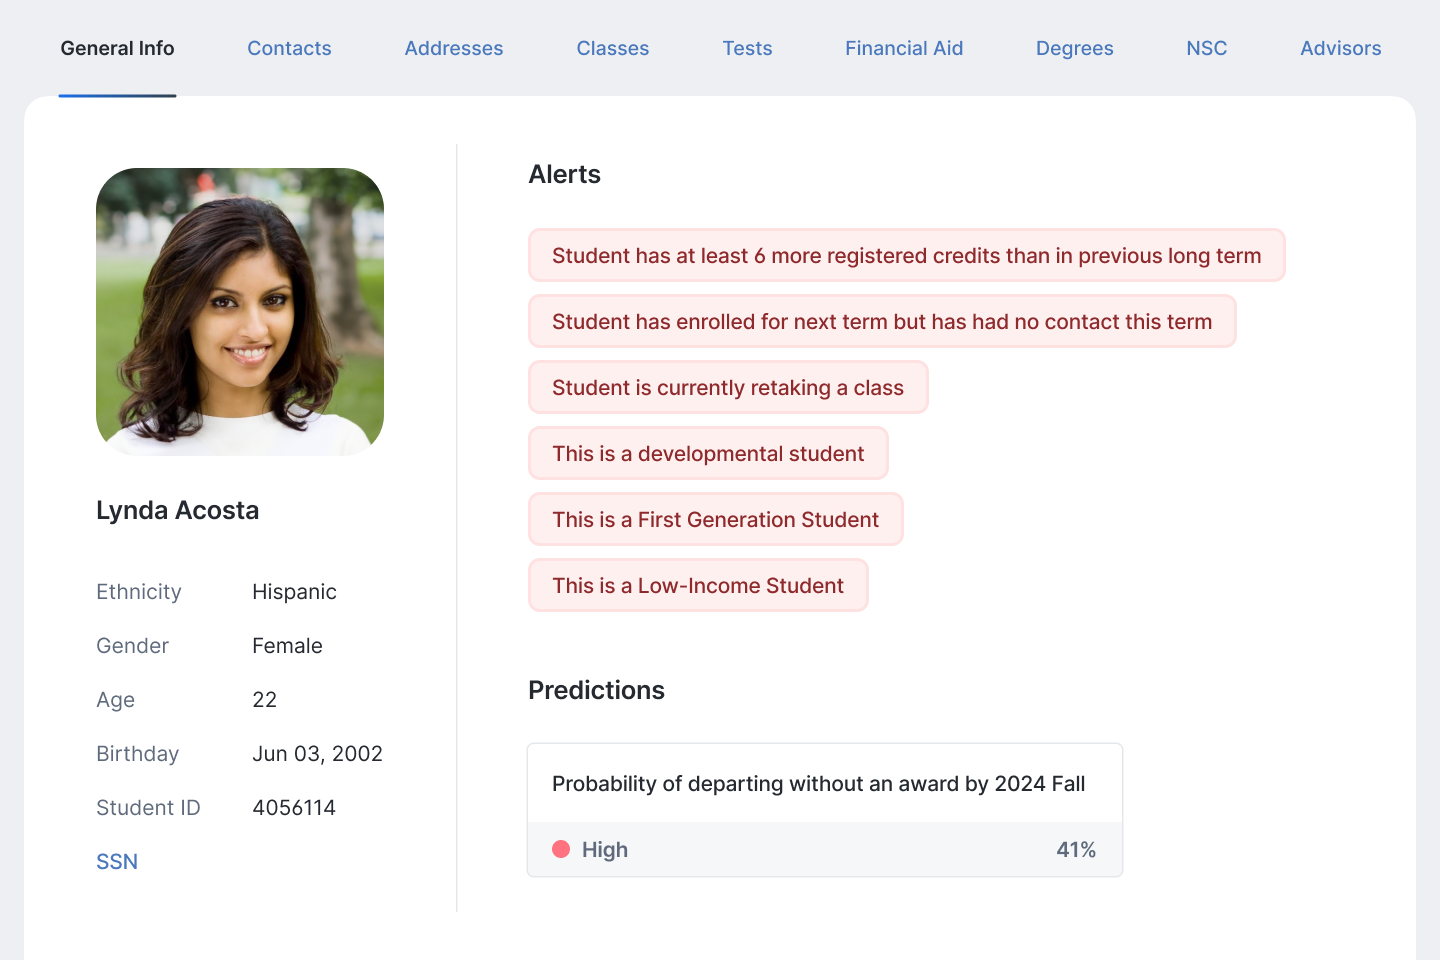
Most tools show you charts – Student Navigator helps you find students. Designed for community colleges, it puts powerful ad hoc querying into the hands of advisors, faculty, and support staff so they can answer real questions in real time. No tickets. No coding. Just fast, flexible access to the exact students who need attention – so your team can act before it’s too late.
When the Answers Are Out of Reach, Students Slip Through the Cracks
Advisors know which students need help – but they can’t always get to them in time. Simple questions turn into complex requests. Lists live in spreadsheets, not systems. And the people closest to students are left waiting, guessing, or giving up. It’s not for lack of caring – it’s a lack of access.
End Users Can’t Access the Data They Need
Advisors and faculty are constantly waiting on IR or IT to pull reports, slowing down critical outreach and interventions.
Dashboards Can’t Adapt to Real Questions
Most BI tools require a new dashboard - or a major redesign - every time someone wants to ask a new question or look at a different group of students.
Student Lists Live in Silos
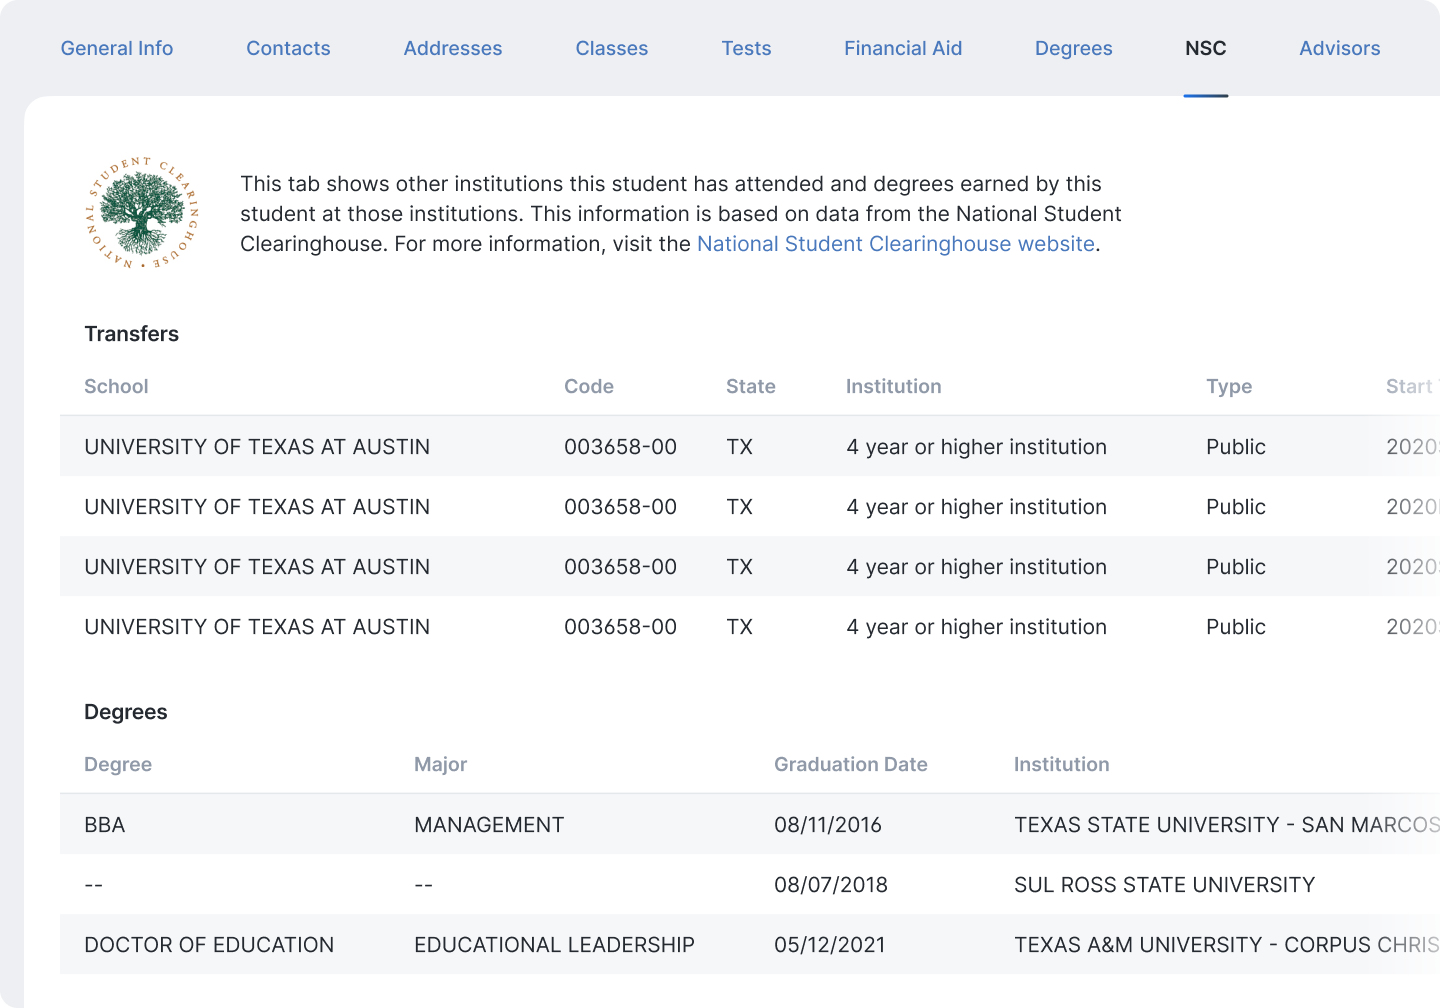
Whether it’s orientation attendees, workshop participants, or CRM-tagged students, the most valuable student lists often aren’t in the SIS or LMS - and can't be analyzed in most systems.
IR Teams Are Overwhelmed with Requests
Routine data pulls and custom dashboards pile up, leaving little time for strategic analysis or long-term planning.
“Due to the volume of students we have, it’s crucial that we are able to easily track student contacts with a tool like ZogoTech. Because ZogoTech includes all the types of contacts we have with students, I can accurately describe the kind of interaction I’ve had with any student."
Retrieve, on-demand, a complete picture of student performance, allowing you to react while there’s still time, intervening when it matters most.
Ad Hoc Power Without the Headaches
The answers you need – when you need them – with zero code and no report backlog.
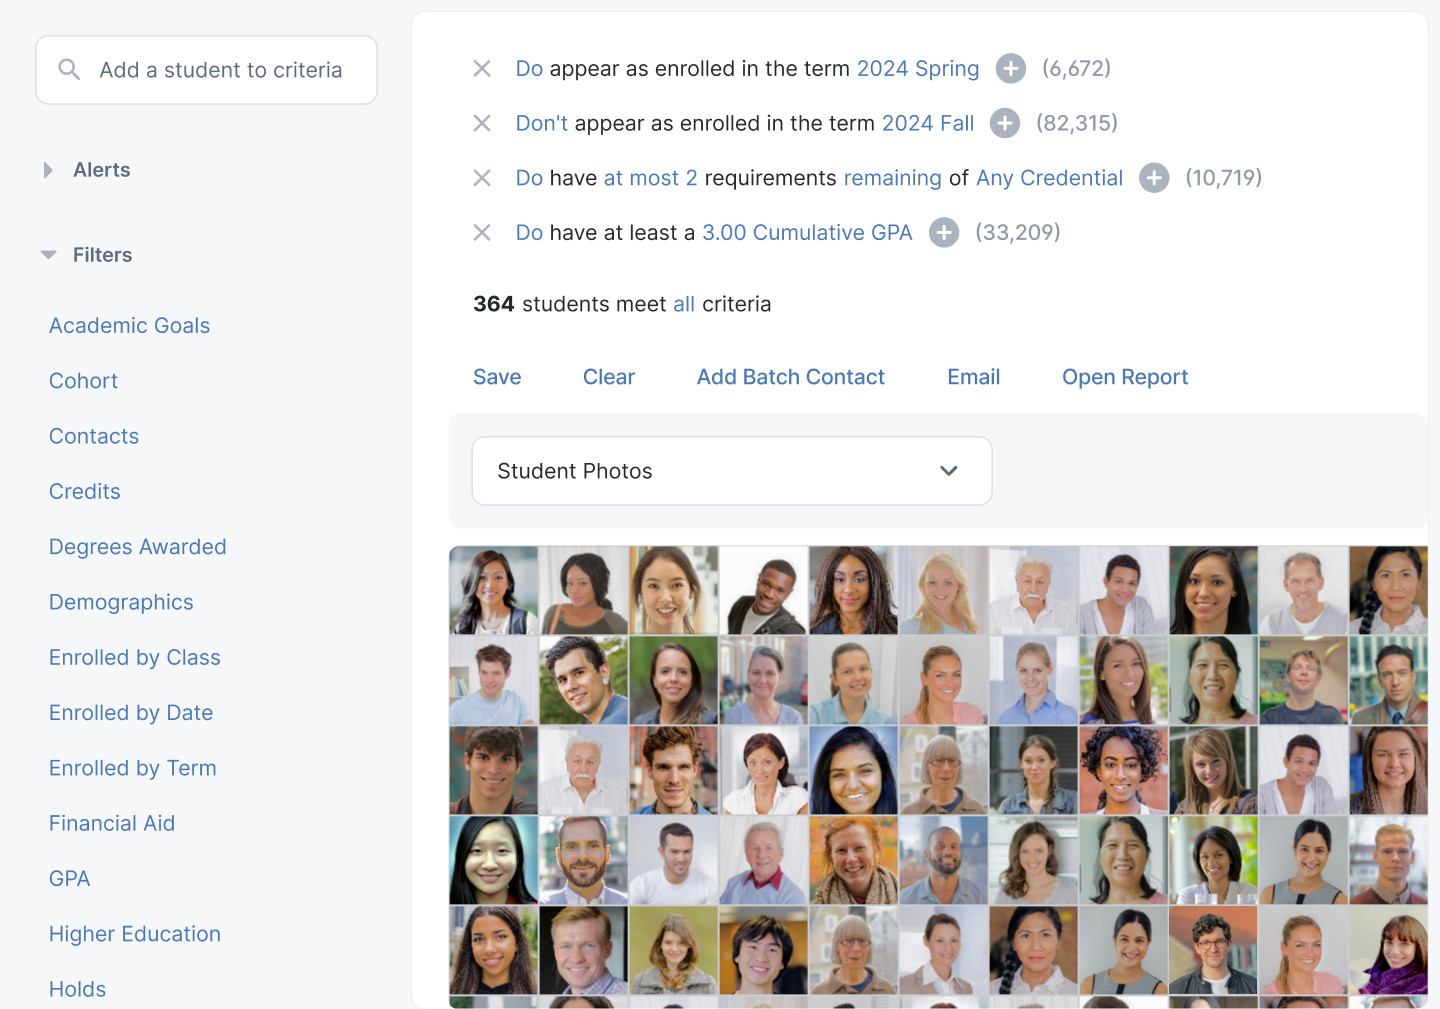
Build complex, custom student queries on the fly using intuitive filters.
Combine multiple data points with AND/OR logic – no need for SQL or designer support.
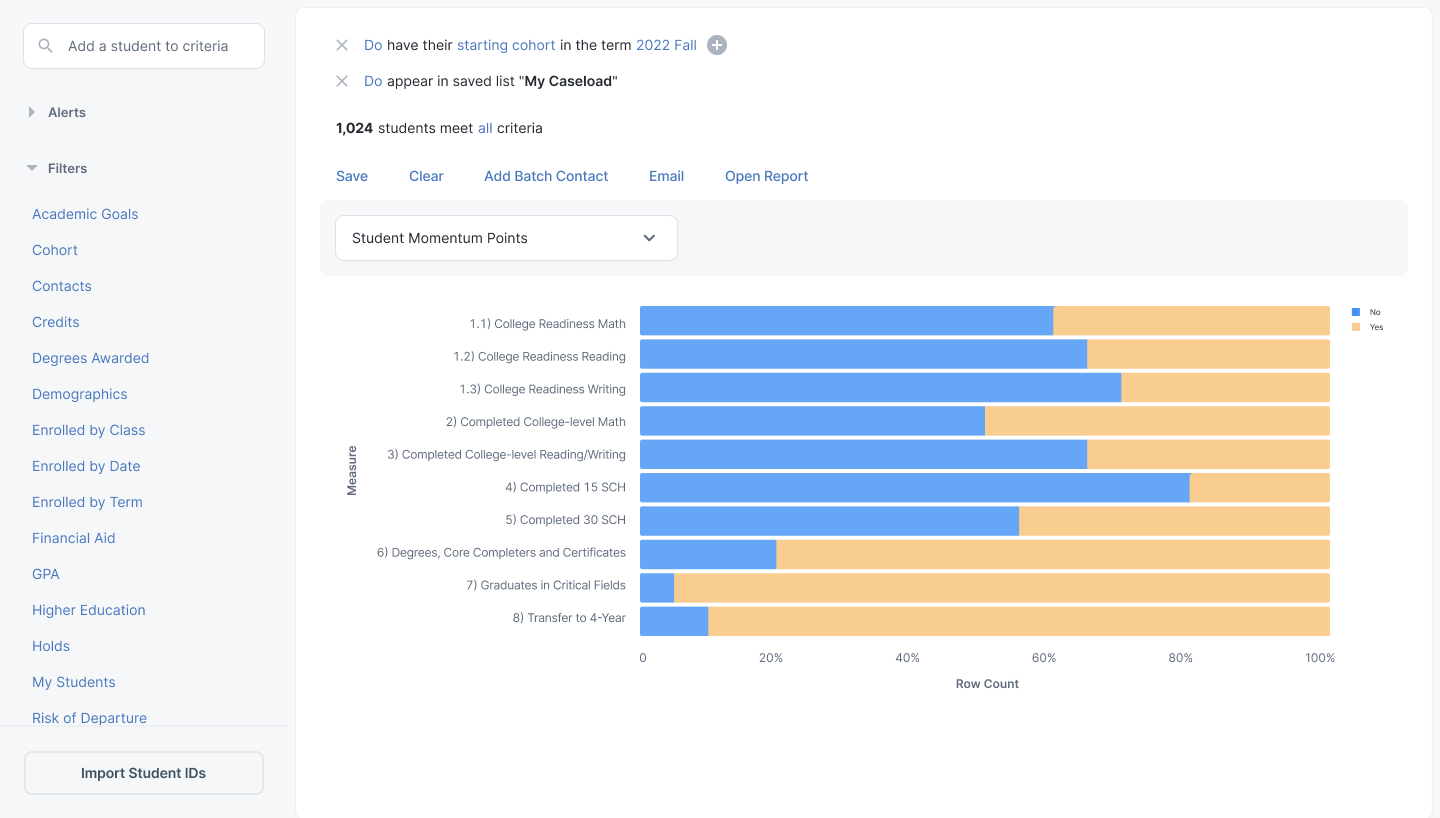
Drill into real student lists behind the metrics, not just summary charts.
Save and reuse filters to quickly answer recurring or evolving questions.
One Dashboard. Infinite Questions.
Stop cloning dashboards for every request – build once, use everywhere.
Apply any saved dashboard to any group of students – instantly.
Filter by imported lists, saved segments, or on-the-fly selections.
Customize without breaking or duplicating the original report.
Share dashboards across departments without version control chaos.
Turn Lists Into Insights - Instantly
Whether they’re in your CRM or a spreadsheet, bring student lists to life.
Upload any CSV with student IDs – orientation attendees, support program participants, etc.
Apply dashboards, filters, and predictive metrics to non-SIS lists.
Create and share saved filters from these custom groups.
Enable every department to analyze their own student populations.
See the Student Journey Over Time
It’s not just who’s at risk – it’s when, how, and why.
Visualize how long it takes students to complete gateway courses or degrees.
Track enrollment gaps, credit milestones, and course-to-course progression.
Calculate conditional probabilities based on key events or behaviors.
Filter by student type to uncover performance gaps in progression and outcomes.
“The time that we have is extremely precious. We are able identify characteristics about our students using the navigator tools and its comprehensive components that we weren't maybe historically and we were missing on students.”
Traditional dashboards can only answer the questions they were built for. With Student Navigator, staff can explore, filter, pivot, and segment student data on their own - no ticket, no wait, no SQL.
Built for the Way Student Support Actually Works
Advisors don’t want summaries - they want names. Navigator lets them find the exact students who need outreach, apply filters in real time, and even upload their own lists to see insights instantly.
One Report. Thousands of Use Cases.
No more making a new dashboard for every audience. Create a single report and let every department apply their own student group, term, or filter - without breaking or duplicating anything.
Frees Up IR to Focus on Strategy, Not Support Tickets
By shifting everyday requests out of the IR queue, Navigator reduces burnout and lets your team focus on long-term planning, forecasting, and institutional performance.
Empowers Non-Technical Users to Act on Data
Designed for humans, not analysts. Faculty, advisors, and support staff can explore complex student trends, apply predictive filters, and take action - without ever opening Tableau or Power BI.
Designed for Community Colleges
Student Navigator is designed for the realities of community colleges - small teams, limited time, and urgent student needs. It works out of the box, no coding required, so anyone can get answers fast and make an impact right away.
Testimonials About Student Engagement
“I would say learning about students with the numbers is the greatest way ZogoTech has helped us... making it really more personalized to the students. So instead of only looking at those high level metrics as a college, what we're doing is allowing users to break down into smaller and smaller populations that they can actually go out and make an impact for specific students.”
"We’ve been using ZogoTech since 2010. Just within the last few years, we’ve worked to develop these dashboards. And they’ve been awesome for us – they’ve been so helpful. We can keep a pulse on the student, see where the student’s at, and reach out to them at the first sign of distress."
“I track the progress of my students and my interactions with them. I want to document that so that we can, for data purposes, see if we’re retaining the students and if the work that I’m doing is making a difference.”
“With ZogoTech, our advisors can access the information they need quickly and easily, allowing them to be proactive, intentional and innovative, ultimately helping to keep students on the path to success.”
"ZogoTech is being used to monitor enrollment. To monitor students progressing to their degrees. I mean, ZogoTech is all about supporting student success. And we use it extensively in our student services, program areas to address those kinds of things."