ZogoTech’s suite of tools for data exploration, data visualization, and self-service ad-hoc queries can be used alongside, or instead of, traditional community College business intelligence tools like PowerBI and Tableau.
If you already have a visualization tool, you can supercharge it with ZogoTech.
Traditional community college business intelligence tools allow IR / IT to create attractive reports and dashboards for end-users. However, these tools have some notable gaps.
Ad Hoc Reporting Burdens IR
With traditional Visualization tools, end users must go through report designers for even minor changes, which frustrates end users, stifles a culture of inquiry, and strains already overworked IR/IT departments.
Limited Data Analysis
End users can only do simple filters. They cannot, for example, pick out students who are “Low-income OR First-generation.” Enabling this requires more coding by IR / IT.
Versioning and Maintenance Issues
If a user wants to view the report with a different group of students or if users want different filters for their dashboards, the designer has to create multiple copies of the report, leading to maintenance issues.
Data Cannot Be Trusted
Data definitions are inconsistent, reports are created from scratch, data is pulled from multiple systems, and KPIs are manually calculated - all increasing the likelihood of bad data.
“We need consistent data. In ZogoTech, the enrollments, majors, and courses are all consistently available. And ANY person who goes to ZogoTech and pulls that data is going to get the same data - so we are going to get the same results.”
Dr. Douglas Walcerz
Provost, VP of Academic and Student Affairs, Lee College
ZogoTech's Data Analytics Platform
ZogoTech’s data warehouse consolidates data from multiple data sources (SIS, NSC, LMS, etc), takes snapshots of the data, and transforms the raw data into meaningful information (e.g. to predict which students might be at-risk). This makes it much easier to create reports in your favorite community college business intelligence tool.
Drag, Drop, Pivot, Publish
With traditional BI tools you get a fairly static report with a few filters. Changes have to go through expert users (IR/IT).
With ZogoTech’s easy-to-use BI tool, users can easily explore their data on their own without extensive training.
Drag / Drop / Pivot / Publish
Embedded Data Dictionary
Data lineage showing how fields flow from different data sources
Detailed description of how every field is calculated.
User data dictionary: customizable definitions with example usage.
Personalized and Actionable
Allow end users to personalize the data to their role (e.g. students on their caseloads or in their department).
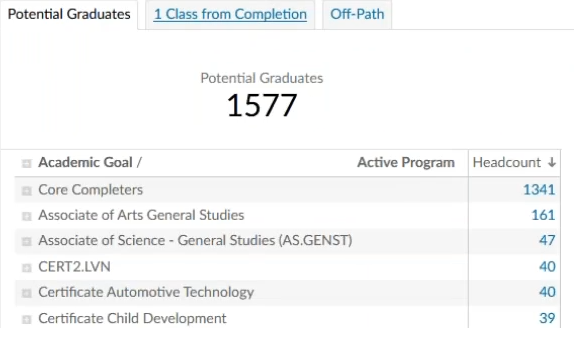
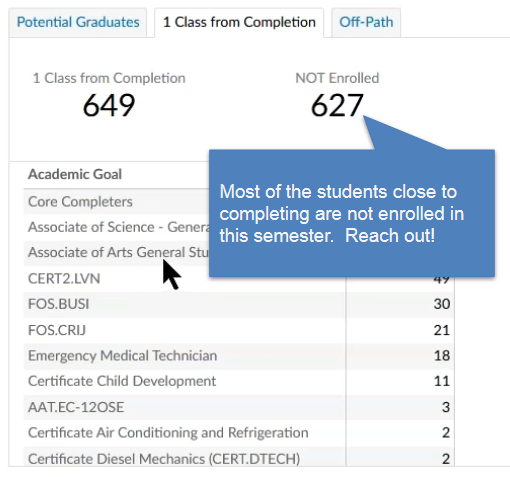
End users can run sophisticated queries without burdening IR / IT. Left: An advisor finds students on her caseload who enrolled in 2019 Fall, but not enrolled in 2020 Spring (yet), who are 1 requirement away from completing a degree, but can’t register due to holds.
Turn data into action: one click to contact all of those students and record the contact for future assessment.
Increase Transfer and Reverse Transfer
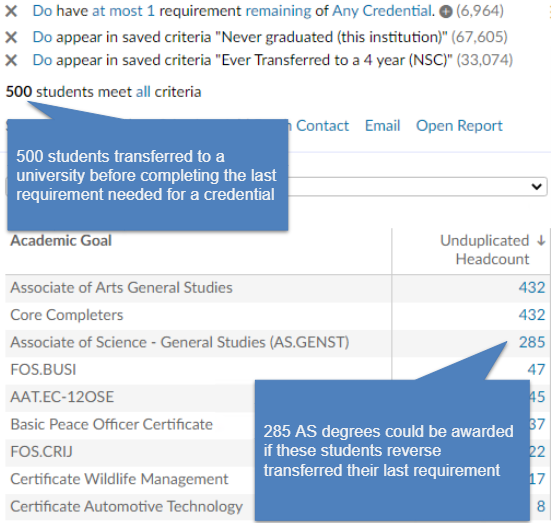
Leverage National Student Clearinghouse (NSC) information to identify students who were 1-2 classes away from completing a credential (any credential, not just the one they were pursuing), but transferred to a university.
Find students who transferred to a university but dropped out.
Improve transfer pathways: setup different transfer pathways for different programs at each university. Then automatically view or query student progress towards each pathway.
Testimonials About ZogoTech Reporting
"The time it took to create the reports, create the dashboards, create the access and the sharing and the different user groups and so on… probably a 3rd of the amount of time it took in ZogoTech compared to what took me in Power BI. So just from a maintenance and cost perspective, this tool definitely well above my office trying to build and maintain them through Power BI on my own."
"Whereas before, faculty member might have to call the Institutional Effectiveness office for the creation of a report. That would take days and sometimes weeks to generate. Now we can direct them through ZogoTech to that specific report or that specific information – providing them just-in-time data to support their needs."
"ZogoTech is one of the very best database management tools out there. Before that, we had a homegrown system. But with ZogoTech, we can slice and dice, drill down, segment… it has been an extremely powerful analytical tool for us. "
"We’ve had Tableau for years and we’ve been struggling figuring out how to use it. It wasn’t automatically updating, a lot of it was manual trying to figure out which files to pull in. And really the only thing they built was based on flat Excel files – not updatable, just aggregate numbers."
"It would’ve taken us weeks to do a simple report – just to extract the data from our ERP system and get the data prepared and ready to go. Cleaning it, doing calculations, and validating those calculations. It would’ve taken us weeks and now it takes us hours."